Task 1 Data
The Task 1 data consists of simulated hearing aid inputs that have been constructed using a set of real high-order ambisonic impulses that were recorded for the challenge. The scenes follow the construction used in the 2nd Clarity Enhancement Challenge and consist of a target sentence and either two or three interferers. The interferers can be speech, music or noise from domestic appliances in any combination. We have published a 2,500 scene development set. A further 1,500 scenes were recorded and have been set aside for evaluation. The training data from CEC2 is available for use in training.
The data is organised into the following directories, and can be obtained from the download page.
clarity_CEC3_data
|── manifest
|── task1
|   └──clarity_data
|       |── metadata
|       |── train (use CEC2)
|       └── dev
|           |── scenes
|           └── speaker_adapt
|── task2
└── task3
The sections below describe the impulse response recording setup, the signal mixing and the format of the audio files and metadata provided for each scene.
Recording setup
The task uses a novel set of impulse responses that were recorded at the University of Salford using an mh acoustics em64 Eigenmike. These responses can then be used in place of the 6th order ambisonic impulse responses that were generated using room simulation in the previous challenge.
Recordings were made for 32 random configurations of a listener, a target and up to three interferers. Configurations were randomised in advanced and marked out on the floor of the recording room. For each configuration, the microphone is placed at the position of the listener and a loudspeaker is placed, in turn, at each of the sound source positions and directed towards the microphone. The sine-sweep method is then used to estimate the impulse response. The process is repeat for all 32 configurations and for target and three interferers, i.e. 32 x (3 + 1) = 128 impulse responses are recorded in total.
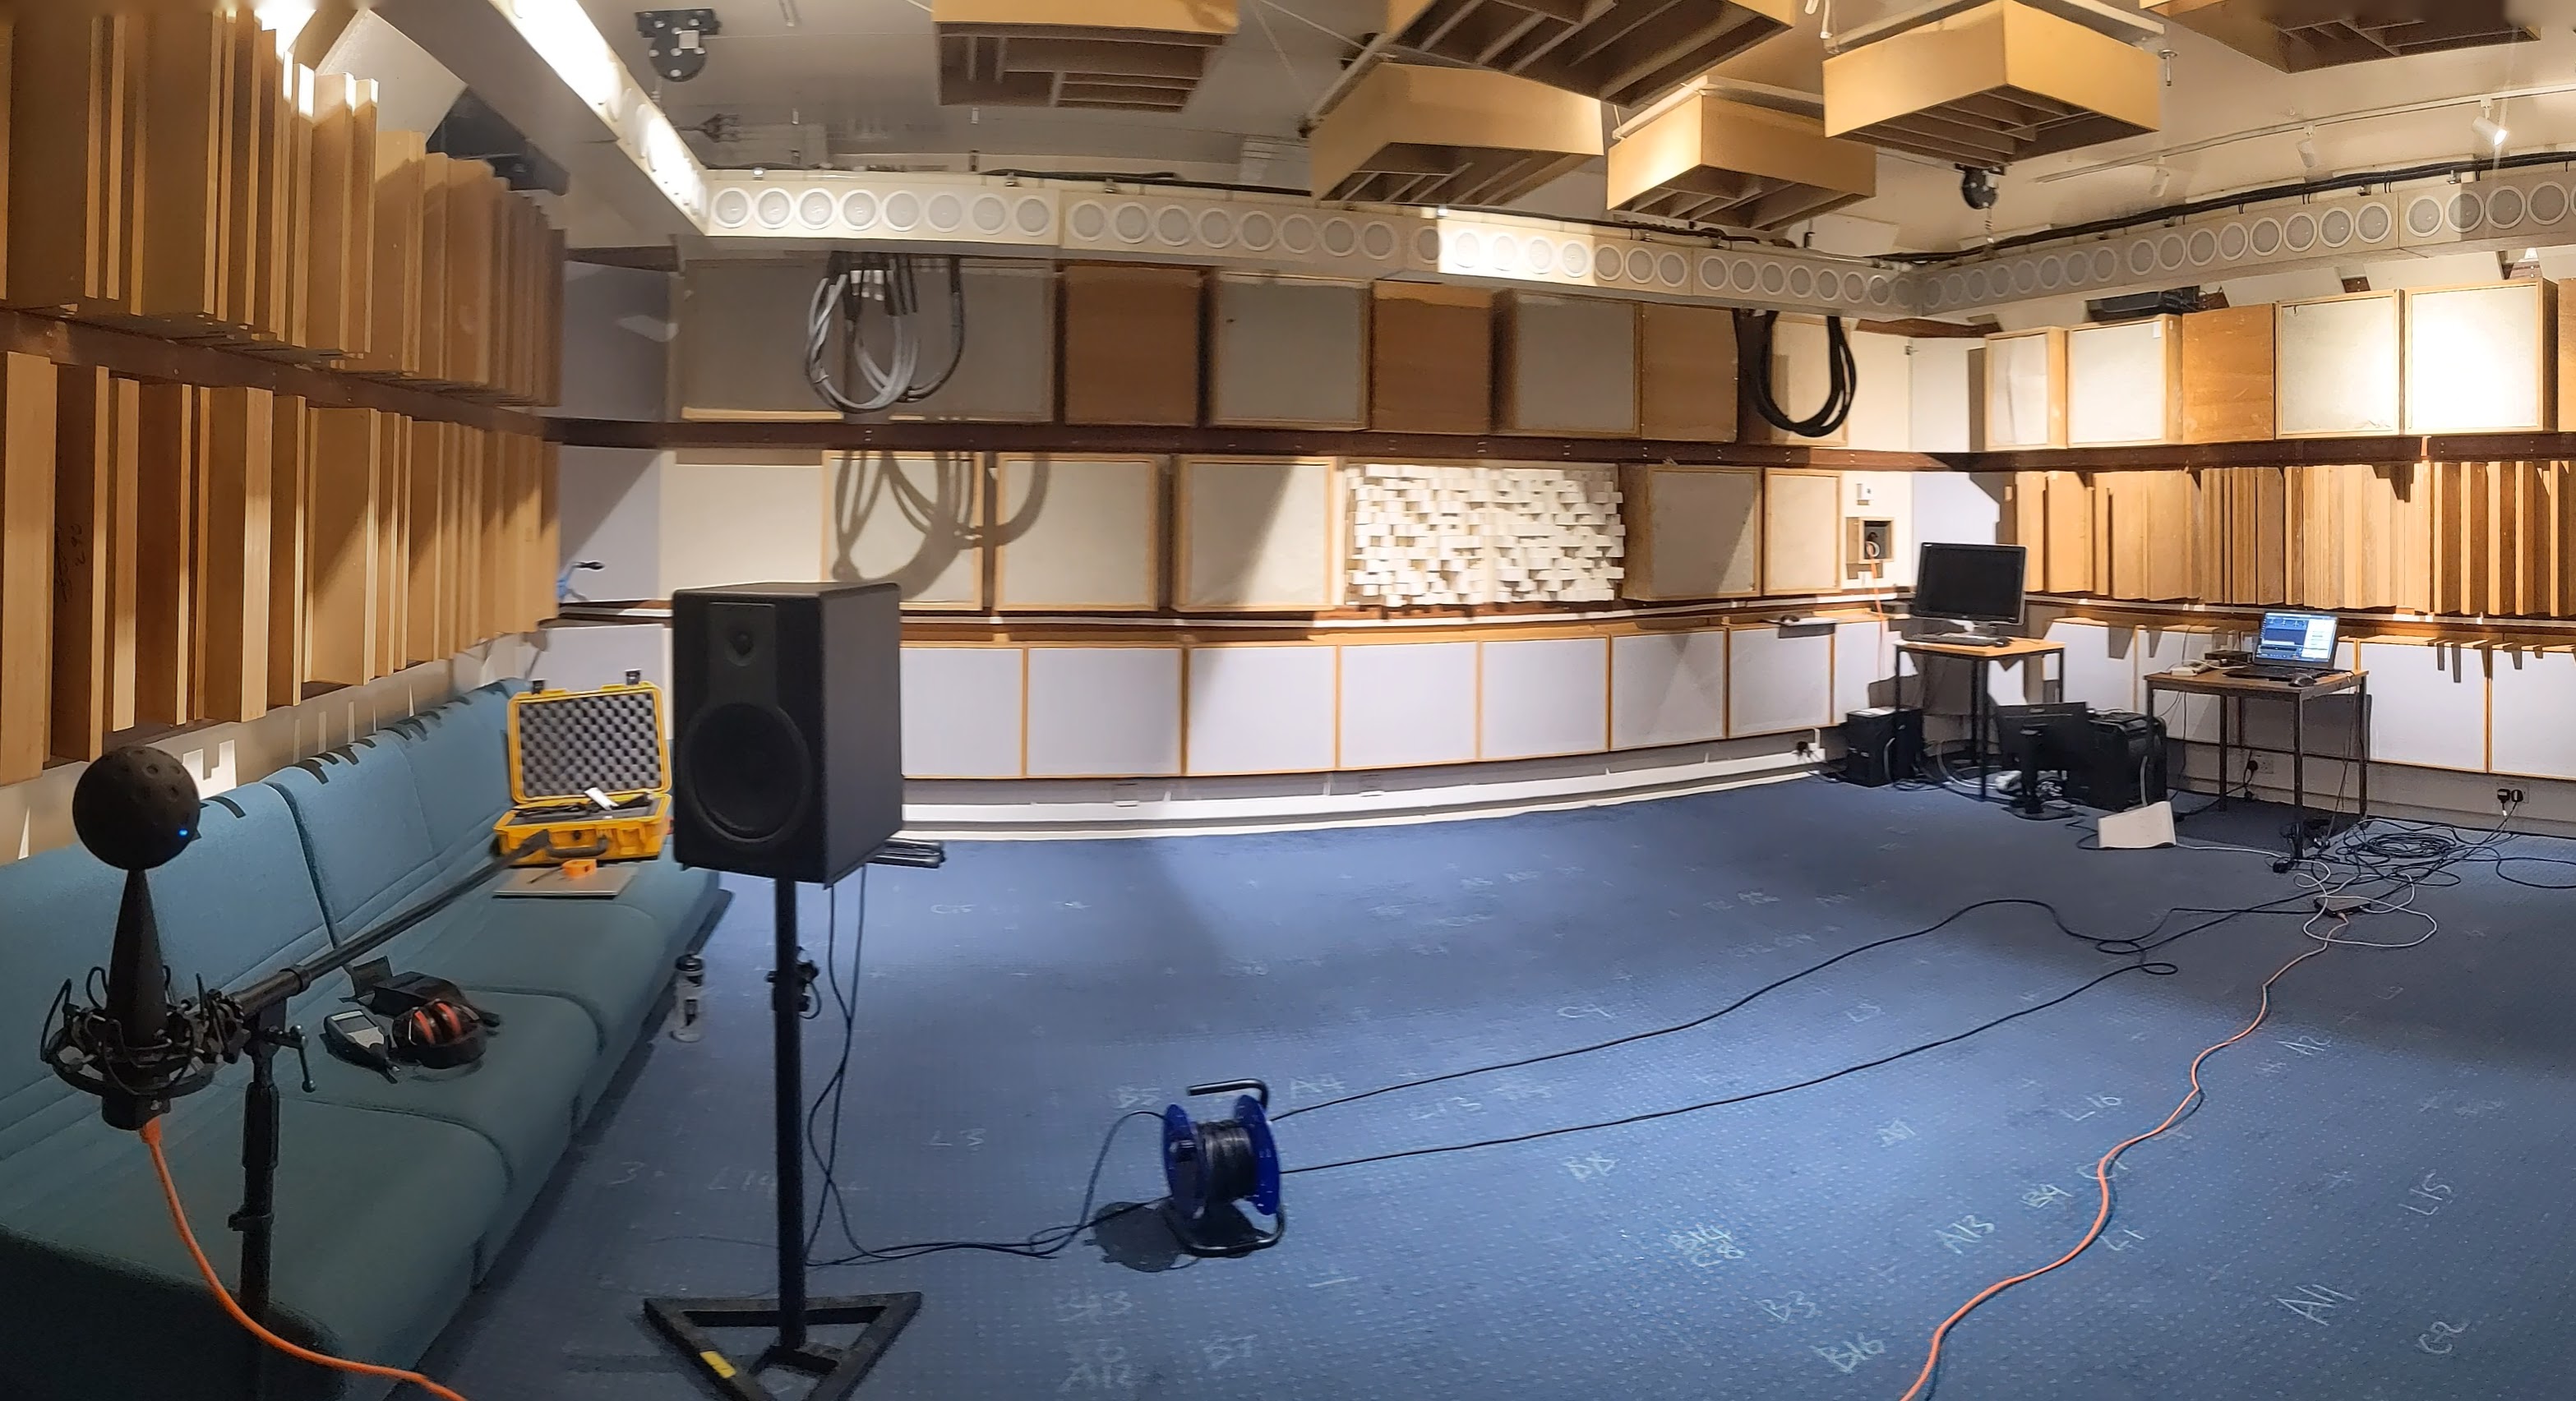
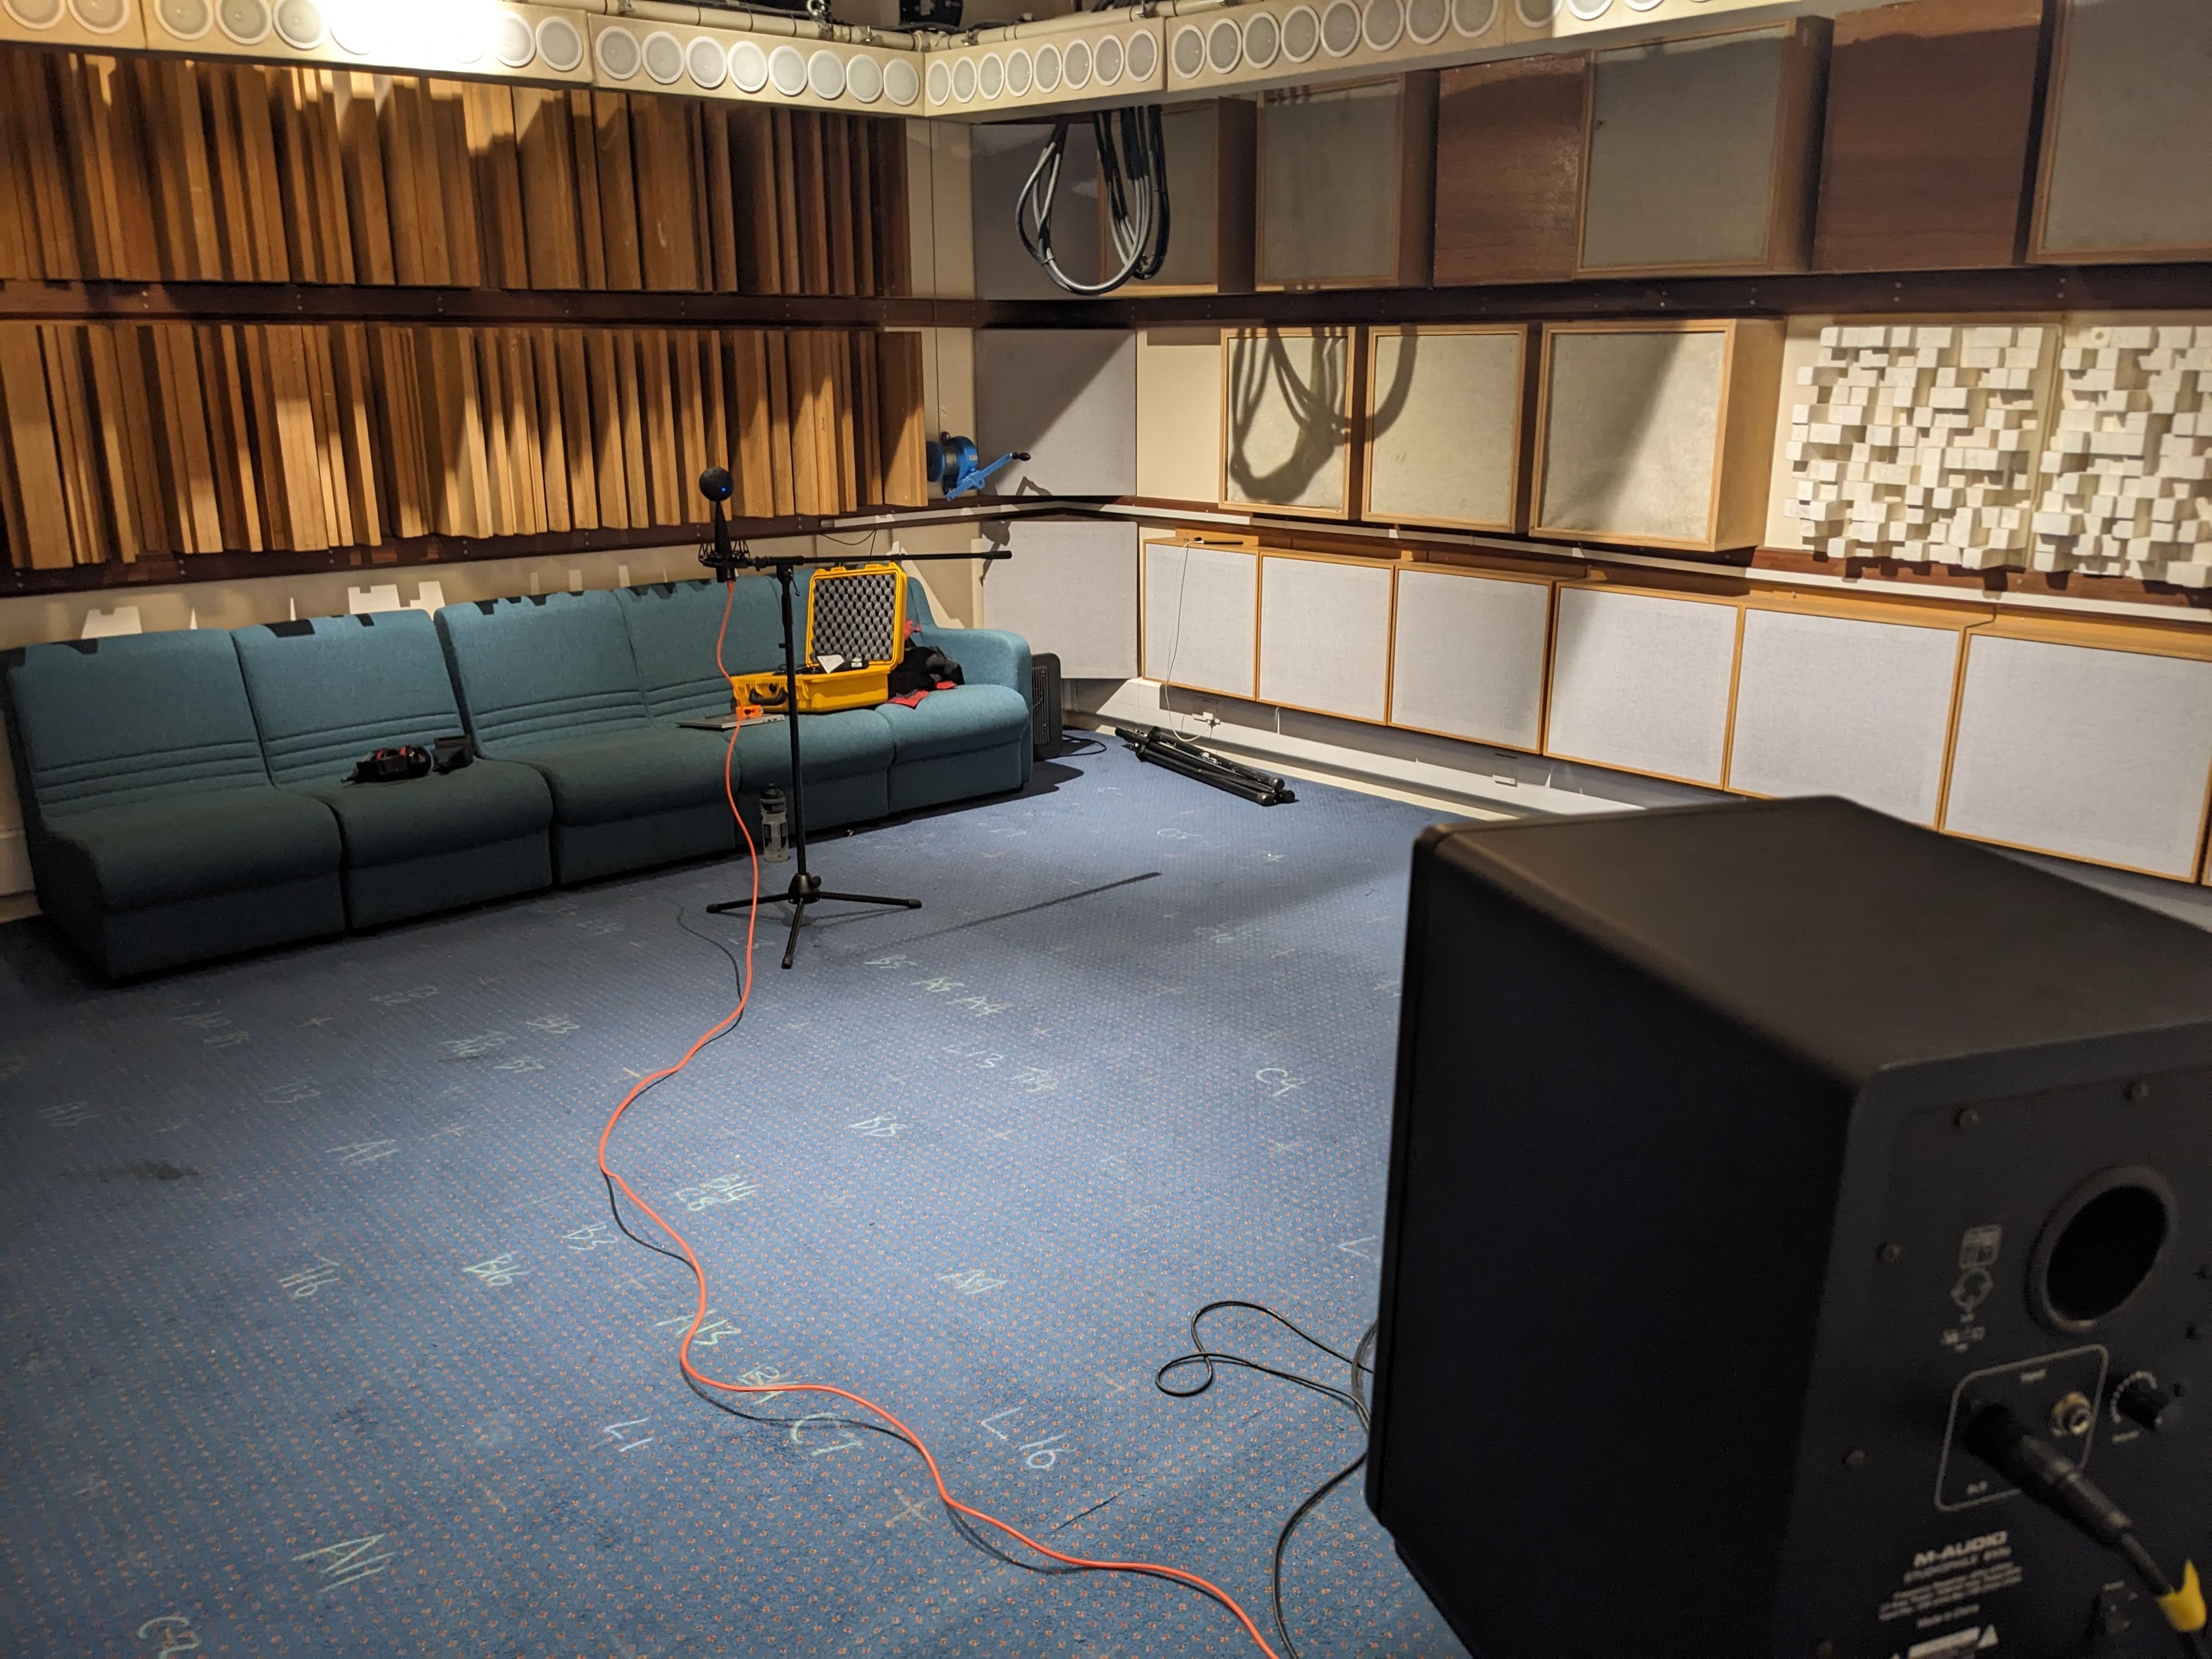
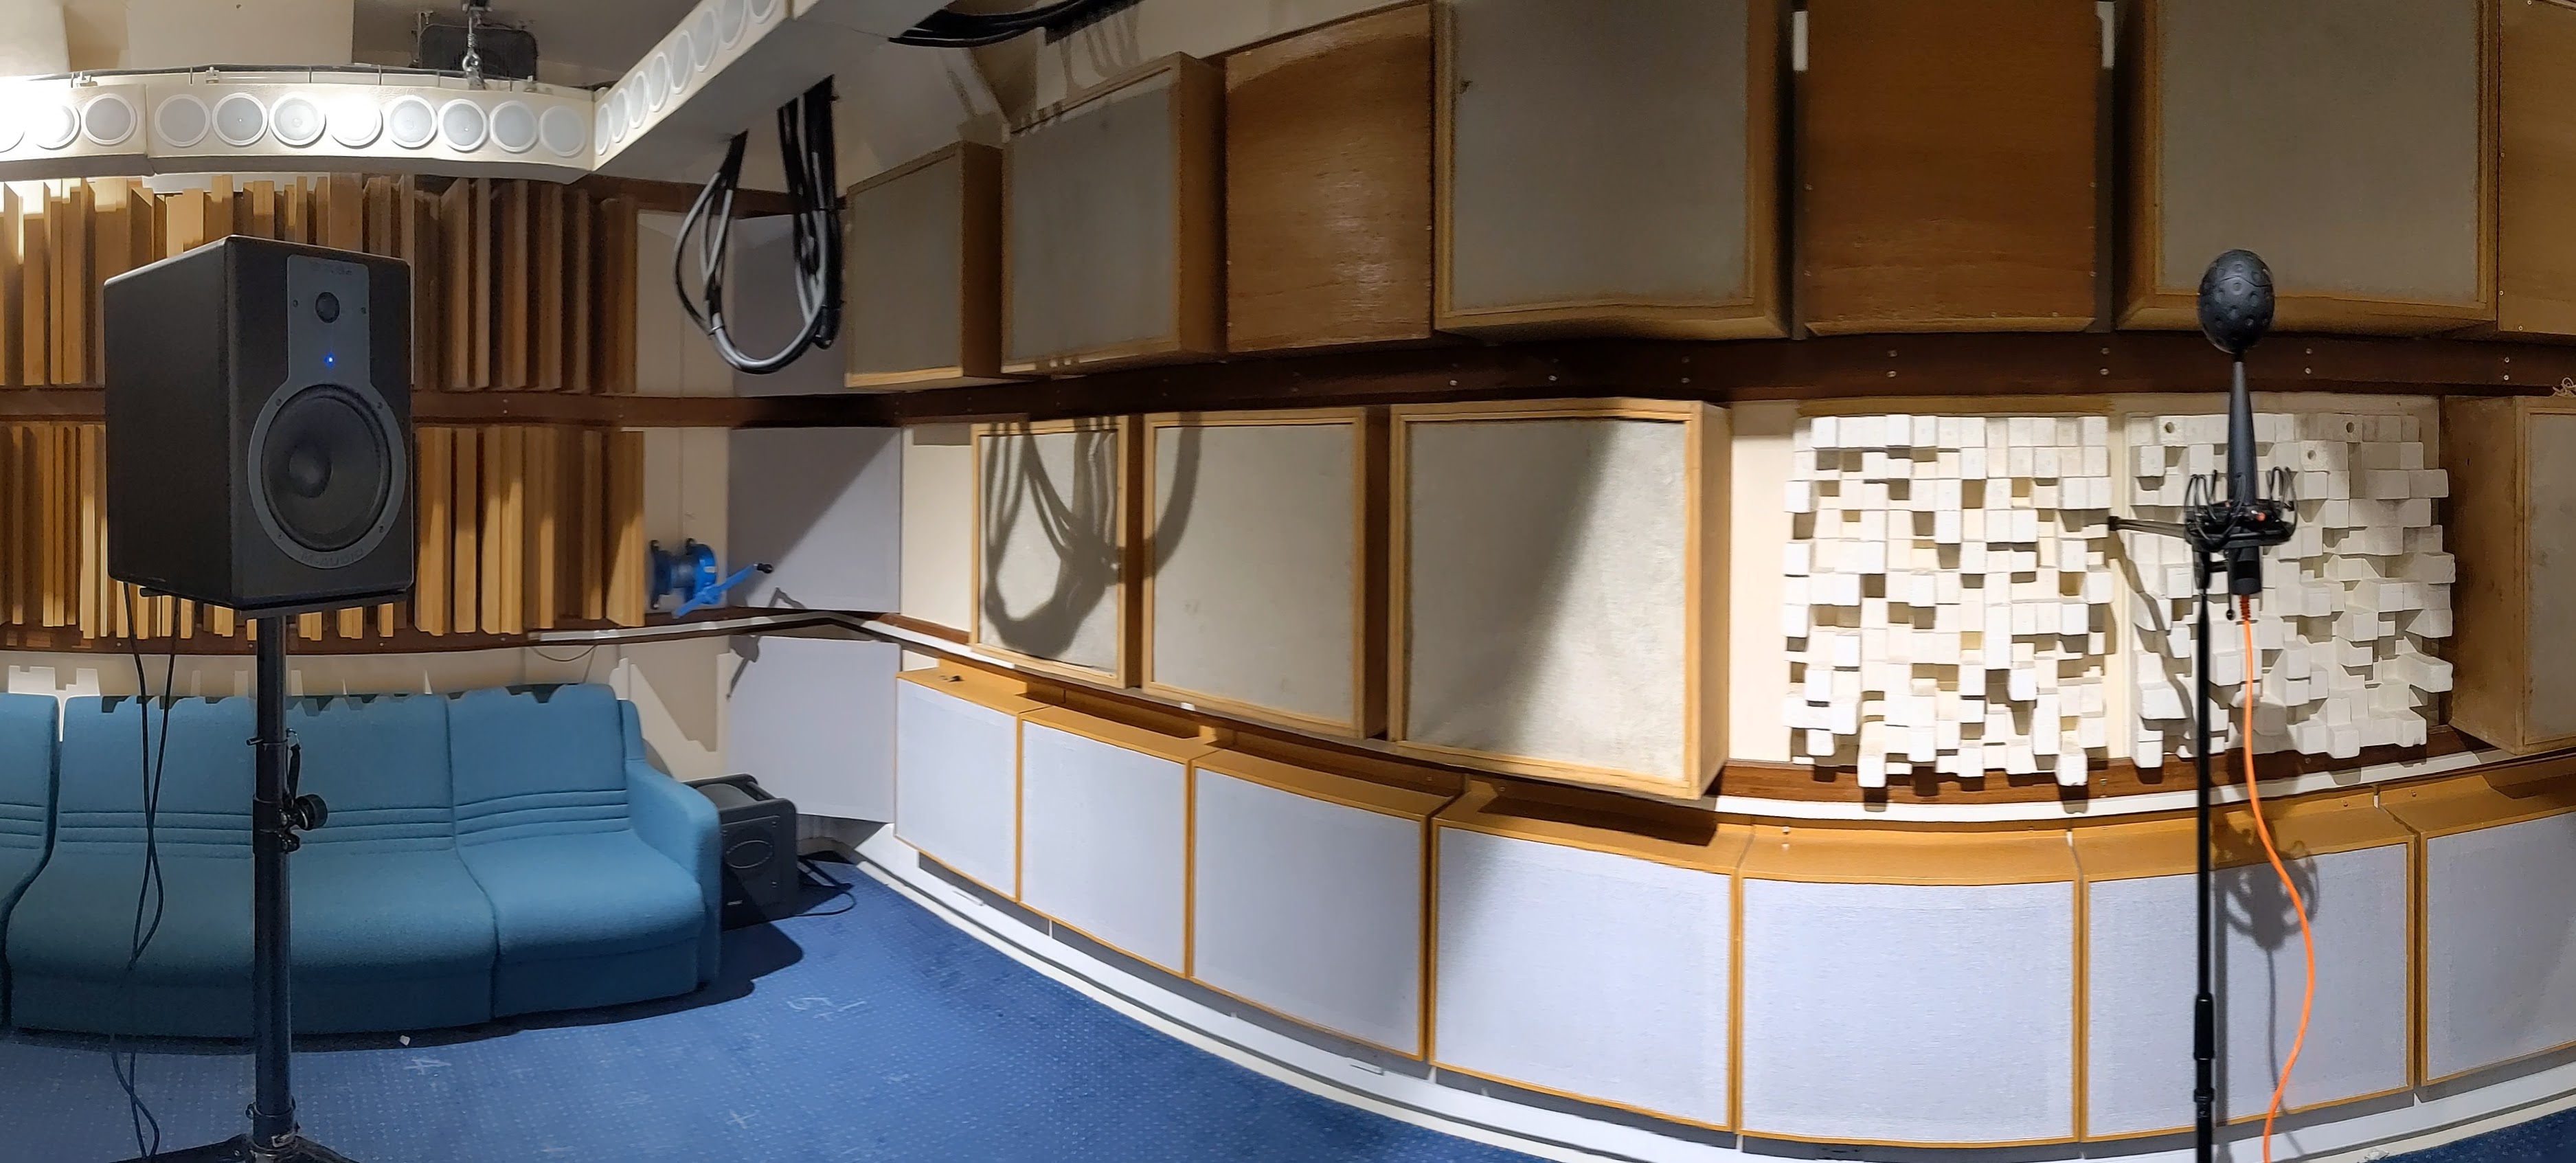
The room is an acoustically treated recording room with approximate dimensions of 5m x 5m x 2m. Some images are provided below for context.
- The recording room
- ...another view
- ... and another.
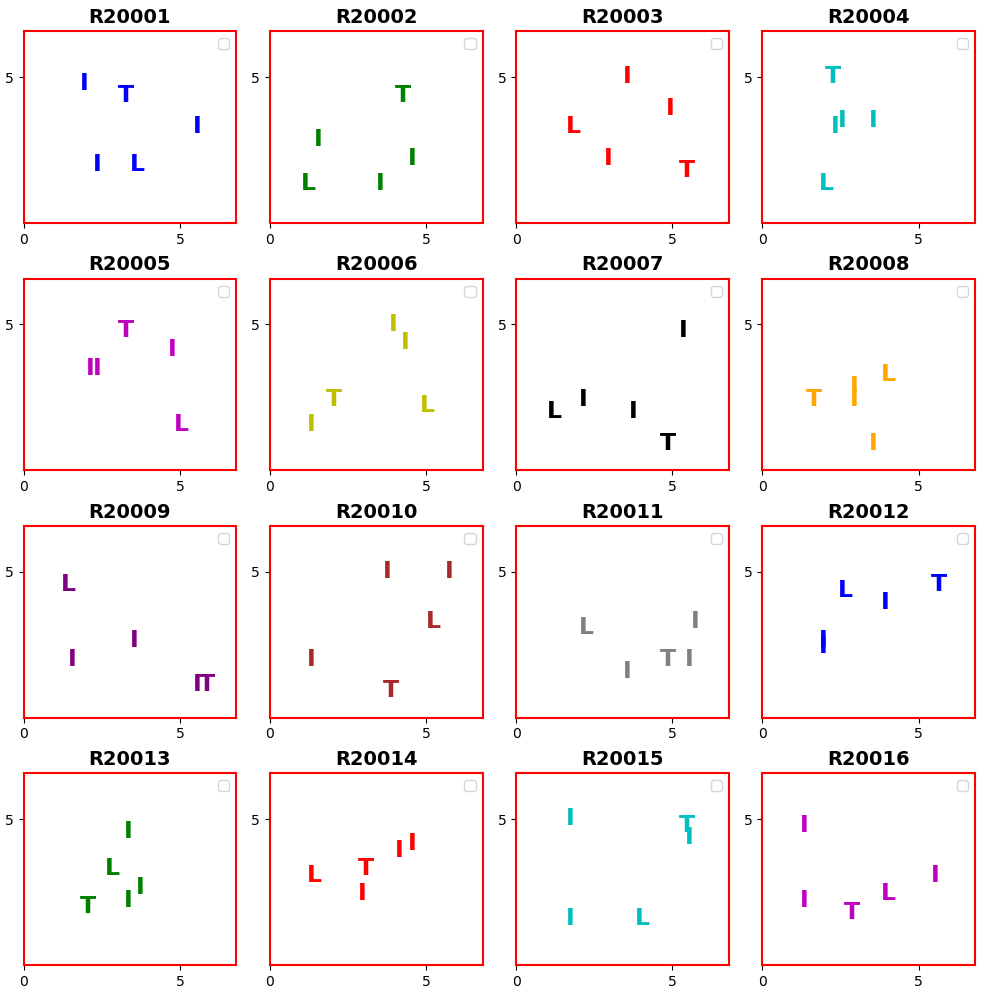
The room configurations were randomly generated by independently selecting the x and y coordinates of the listener, target and interferers. The positions were chosen uniformly at random within the dimensions of the room, excluding a 1m border around the walls. It was also imposed that no sound source should be within 1 m of the listener, i.e., samples were rejected and redrawn if this was the case. As with CEC2, for each configuration a height (z) was randomly chosen to be either 1.2m (simulating sitting) or 1.6m (simulating standing) and the microphone and loudspeakers were placed at this height.
The figure below shows the layouts of the 16 rooms used in the development data. The rooms are identified by the room number (R20001 to R20016) and the precise positions of the listener, target and interferers are given in the metadata files (see Section Metadata Formats).
The hearing aid signal simulation
The hearing aid input signals are simulated using the same processes that were previously used in the 2nd Clarity Enhancement Challenge. The only difference is that we replaced the simulated impulse responses with the real recordings. Key details are repeated here for completeness, and more information can be found on the CEC2 data pages.
Head rotation
The listener is initially oriented away from the target and will turn to be roughly facing the target talker around the time when the target speech starts
- Orientation of listener at start of the sample ~25° from facing the target (standard deviation = 5°), limited to +-2 standard deviations.
- Start of rotation is between -0.635 s to 0.865s (rectangular probability)
- The rotation lasts for 200 ms (standard deviation =10 ms)
- Orientation after rotation is 0-10° (random with rectangular probability distribution).
Signal-to-noise ratio (SNR)
The SNR of the mixtures are engineered to achieve a suitable range of speech intelligibility values. A desired signal-to-noise ratio, SNR (dB), is chosen at random. This is generated with a uniform probability distribution between limits determined by pilot listening tests. The better ear SNR (BE_SNR) models the better ear effect in binaural listening. It is calculated for the reference channel (channel 1, which corresponds to the front microphone of the hearing aid). This value is used to scale all interferer channels. The procedure is described below.
For the reference channel,
- The segment of the summed interferers that overlaps with the target (without padding), , and the target (without padding), , are extracted
- Speech-weighted SNRs are calculated for each ear, SNR and SNR:
- Signals and are separately convolved with a speech-weighting filter, h (specified below).
- The rms is calculated for each convolved signal.
- SNR and SNR are calculated as the ratio of these rms values.
- The BE_SNR is selected as the maximum of the two SNRs: BE_SNR = max(SNR and SNR).
Then per channel,
- The summed interferer signal, i, is scaled by the BE_SNR
- Finally, i is scaled as follows:
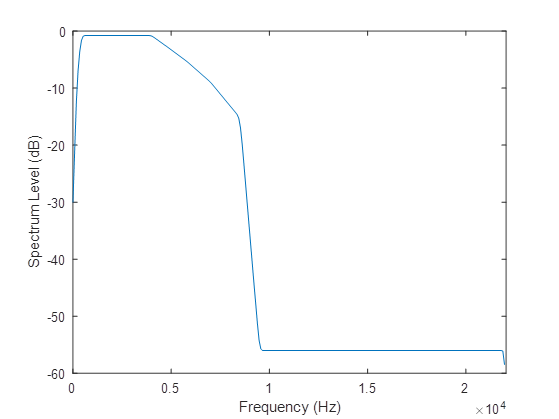
The speech-weighting filter is an FIR designed using the host window method [2, 3]. The frequency response is shown in Figure 2. The specification is:
- Frequency (Hz) =
[0, 150, 250, 350, 450, 4000, 4800, 5800, 7000, 8500, 9500, 22050] - Magnitude of transfer function at each frequency =
[0.0001, 0.0103, 0.0261, 0.0419, 0.0577, 0.0577, 0.046, 0.0343, 0.0226, 0.0110, 0.0001, 0.0001]
Signal generation
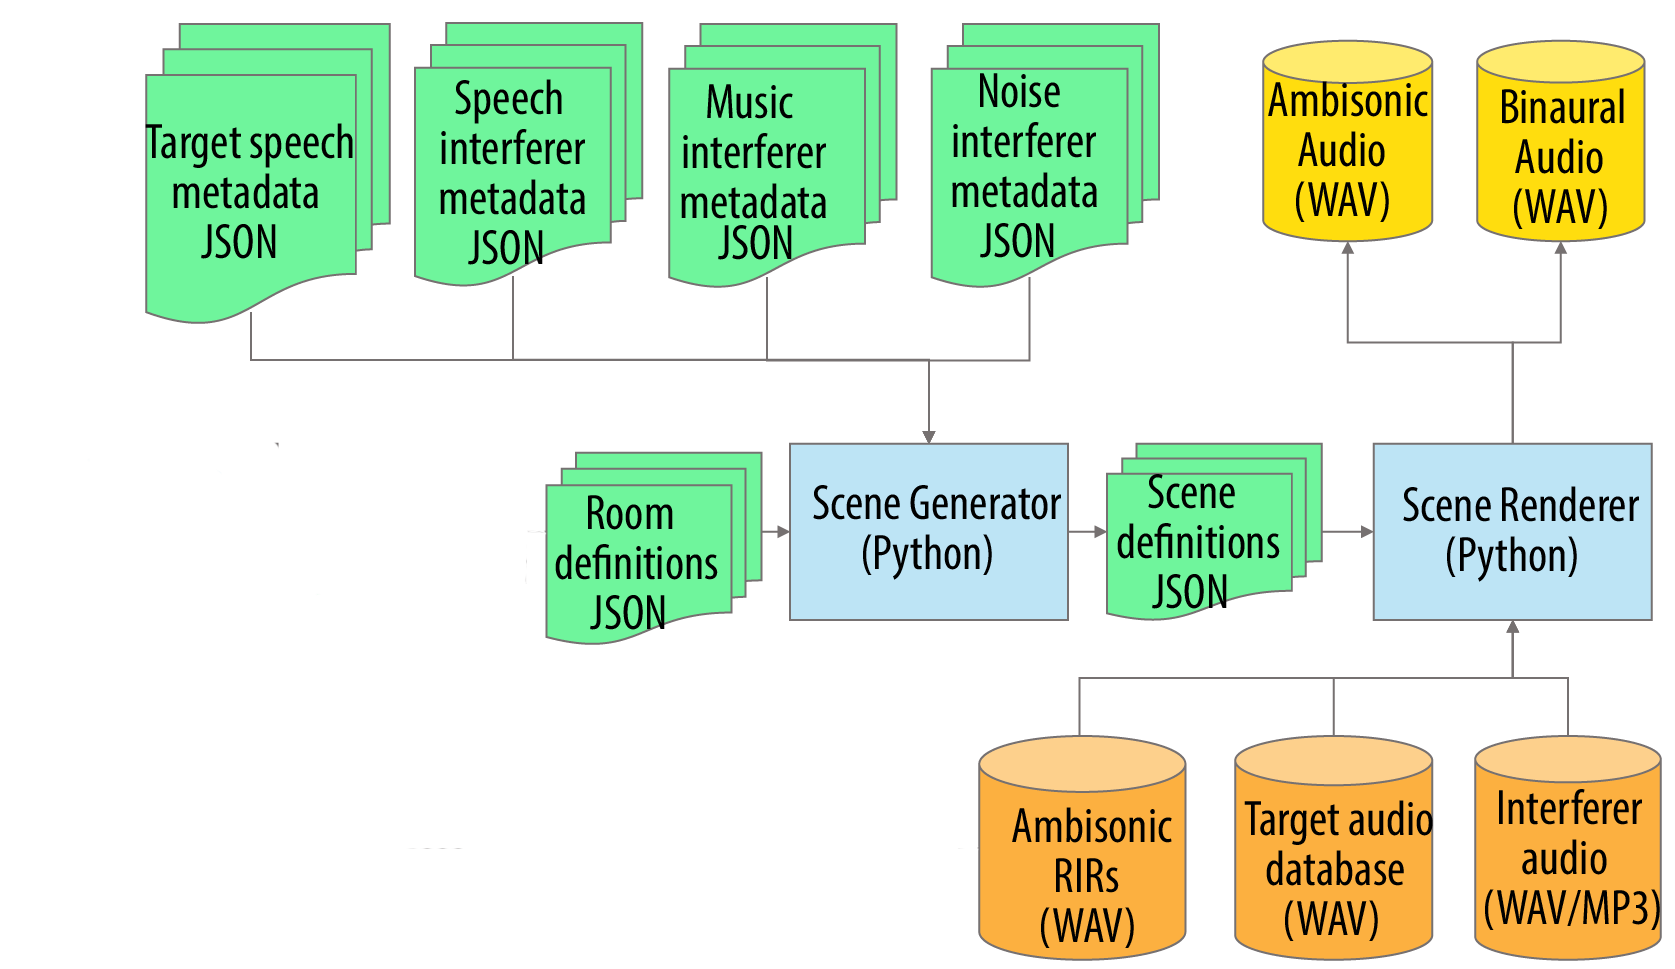
The signal processing pipeline for generating the scene is shown in Figure 4.
- The Scene Generator (middle blue box) works on the metadata (shown in green) to create the scene definition metadata, this includes:
- The metadata associated with the randomly generated scenarios in RPF and JSON format (described on the data page).
- The metadata for the target speech and the three types of noise interferer.
- The Scene Renderer takes the metadata, the ambisonics room impulse responses, and the audio of the target speech and interferers, and then produces:
- Ambisonic audio of the scene.
- Binaural audio for the hearing aid microphones.
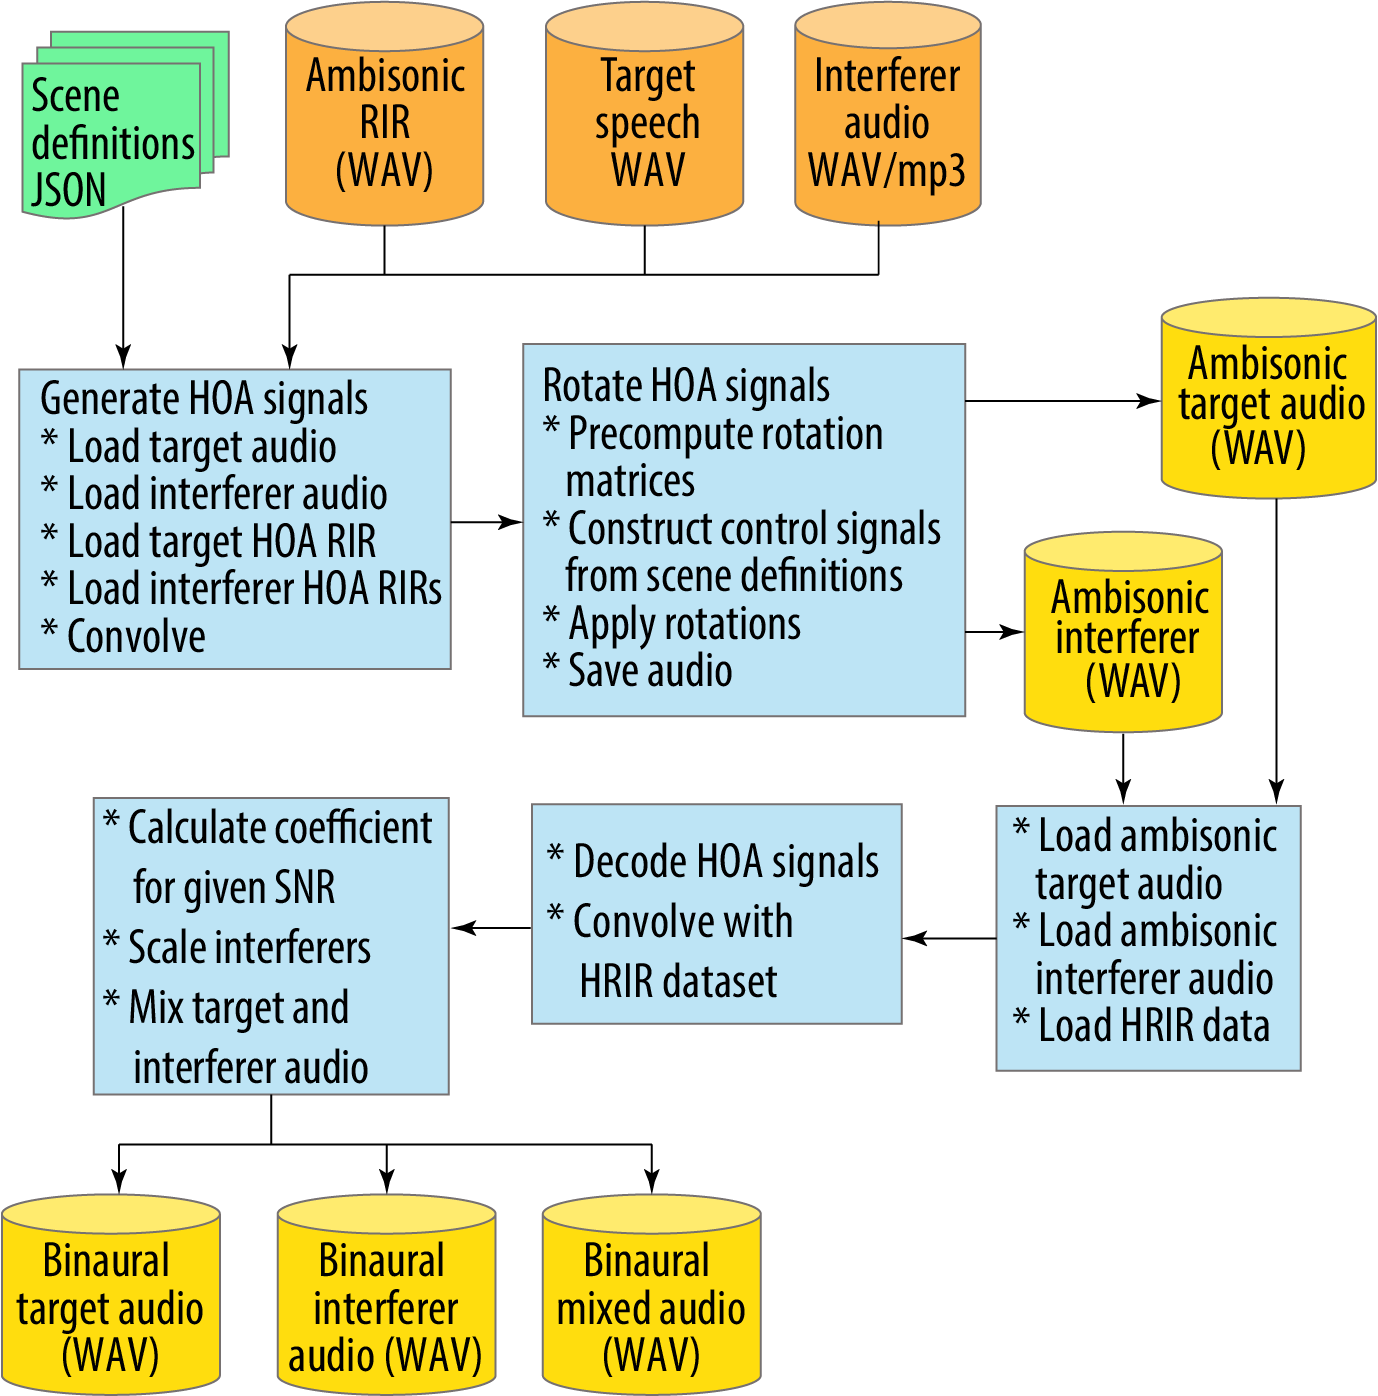
The scene renderer processing is shown in more detail in Figure 5 and is described below:
- It takes the ambisonics room impulse responses (RIR); the target and interferer audio; and the scene definition metadata as the input (top line).
- First, it generates the HOA (High Order Ambisonic) signals through convolution (left blue box).
- Next, it applies the head rotations by rotating the HOA signals and creates ambisonic audio for both the target and interferer audio.
- The third row of three blue boxes is the process to take the ambisonic signals, apply the Head Related Room Impulse Responses (HRIR) to create the binaural signals at the hearing aid microphones (bottom line).
Audio data format
All audio data is provided in 16-bit PCM format at a sample rate of 44100 kHz. File names have been designed to be compatible with previous Clarity challenges. For each scene the following audio files are provided:
- <SCENE_ID>_mix_CH1.wav - the left and right stereo pair from the front microphone.
- <SCENE_ID>_mix_CH2.wav - the left and right stereo pair from the middle microphone.
- <SCENE_ID>_mix_CH3.wav - the left and right stereo pair from the back microphone.
- <SCENE_ID>_hr.wav - the head rotation signal
- <SCENE_ID>_reference.wav - the signal to be used as the reference for HASPI evaluation.
The reference signal is an anechoic version of the target that is to be used as the standard reference for HASPI evaluation. Note, this signal has been processed with the appropriate HRTFs so that it matches the target signal recorded by the front microphone pair at the hearing aid.
The head rotation signal indicates the precise azimuthal angle of the head at each sample. It is stored as a floating point wav file with values between -1 and +1 where the range maps linearly from -180 degrees to +180 degrees. You are free to use this signal in your hearing aid algorithm, but if you do so we would also ask that you evaluate an equivalent version of the system that does not use it (i.e., an ablation study), so that the benefit of known head motion can be measured.
Speaker adaptation data
The scenes that you have been asked to enhance often contain speech signals as interferers. This means that the task of enhancing the target speaker is ambiguous unless you are told which of the speaker to use as target. In this task, we follow the approach used in CEC2 and provide a small set of clean target speaker example utterances. So, for each scene, the ID of the target speaker is provided in the metadata, and systems can then use the examples and select the target as the one that has the matching voice.
Note, these same utterances will be used in the final subjective listening tests, i.e. the listeners will be presented with the examples before listening to the processed signal and told that these are examples of the target speaker that they are meant to be listening to.
Metadata formats
The following metadata files are provided
# The description of the scenes
- scenes.dev.json - metadata for the dev scenes
- rooms.dev.json - metadata for the dev rooms
- hrir_data.json - HRIRs using in the simulation

# Listener information
- scenes_listeners.dev.json - the listeners/scene pairings to for the standard development set
- listeners.json - the audiograms of the listeners

# Materials used to make up the scenes
- masker_music_list.json - the list of music interferers
- masker_nonspeech_list.json - the list of non-speech interferers
- masker_speech_list.json - the list of speech interferers
- target_speech_list.json - the list target utterances
Most of these files follow the same format as in CEC2. The most important are the scenes.json and rooms.json files and these are described below.
The room describes the locations of the three loudspeakers and the microphone. There are 16 different 'rooms' each describing a different loudspeaker and microphone layout (as shown in the earlier figure). The 'scenes' are represented by a 'room' (i.e., a loudspeaker configuration) and a description of the target and interferers and which of the loudspeakers they were played from. Note, there is a one-to-many relationship between rooms and scenes, i.e., each room is re-used in multiple scenes although not always with the same selection of interferer locations.
The room and scene metadata files are described in more detail below.
The room metadata
The room metadata is stored in a JSON file as a list of dictionaries, with one dictionary representing each room. There are 16 room layouts released for development data. A separate set of 15 will be used for evaluation. The metadata for the evaluation set will remain hidden.
The format is as follows:
[
  {
    "name": "R001",  // The Room identifier (R001 to R080)
    "dimensions": "5.0x5.0x2.0",  // Approximate room dimensions (fixed)
     "target": { // The target (i.e., the talker position)
      "position": [ // The target position
        3.0,
        4.2,
        1.2  // Heights are either 1.2 or 1.6 and target, listener and interferer heights are always match
      ],
      "view_vector": [ // The target direction - will be towards the listener
        -0.179,
        0.984,
        0.0
      ]
    },
    "listener": { // The listener (i.e., the microphone position)
      "position": [ // The listener position
        3.4,
        2.0,
        1.2
      ],
      "view_vector": [ // The listener default view direction
        0.179,
        -0.984,
        0.0
      ]
    },
    "interferers": [ // A list of 3 interferer positions
      {
        "position": [
          2.2,
          2.0,
          1.2
        ]
      }, // ... followed by two more positions
    ]
  },
  ... //  more rooms
]
The scene metadata
The scene metadata is stored in a JSON file as a list of dictionaries with one dictionary for each scene. There are 2500 scenes in the development set. A further 1500 have been retained for the final evaluation and these will use a different set of room layouts.
[
  {
    "dataset": "dev", // The dataset (dev or eval)
    "room": "R20001", // The room identifier (R20001 to R20016) corresponds to R001 to R016 in the rooms metadata
    "scene": "S06001", // The Scene ID  (S6001 to S8500)
    "target": {
      "name": "T030_A08_01034", // The utterance ID which starts with the talker ID (T001 to T040)
      "time_start": 80491, // The sample at which the target starts
      "time_end": 214114 // The sample at which the target ends
    },
    "duration": 258214, // The duration of the scene in samples
    "interferers": [ // Either 2 or 3 interferers in positions 1, 2 and/or 3
      {
        "position": 1, // The loudspeaker number (indexed 1 to 3). The location is in the rooms metadata.
        "time_start": 0, // The sample at which the interferer starts (always 0)
        "time_end": 258214, // The sample at which the interferer ends (always the end of the scene)
        "type": "music", // The type of interferer (speech, music, noise)
        "name": "51/662051.low.mp3",   // The interferer ID
        "offset": 2563402 // The offset of the interferer in the complete audio file
      },
      // ... followed by one or two more interferers
    ],
    "SNR": -9.5306,  // The SNR of the target signal (-12 to 6 dB)
    "listener": {
      "rotation": [ // Describes a rotation in the horizontal plane
        {
          "sample": 74252.5369, // The time (in samples) at which the rotation starts
          "angle": 71.2240 // The initial angle in degrees
        },
        {
          "sample": 82883.5369,  // The time  (in samples) at which the rotation starts
          "angle": 97.4871 // The final angle degrees
        }
      ],
      "hrir_filename": [ // The HRIR used to simulate the hearing aid inputs
        "BuK-ED",  // The 'ear drum' HRIR
        "BuK-BTE_fr", // The front microphone HRIR
        "BuK-BTE_mid",  // The middle microphone HRIR
        "BuK-BTE_rear"  // The rear microphone HRIR
      ]
    }
  },
 // ... more scenes
]
- All times in the
scenes.jsonfile are measured in samples at 44100 Hz. - In order to simulate the hearing aid signals, the HRIRs are taken from the OlHeadHRTF database with permission . Different scenes have used different heads as indicated by the
hrir_filenamefield.
References
- Schröder, D. and Vorländer, M., 2011, January. RAVEN: A real-time framework for the auralization of interactive virtual environments. In Proceedings of Forum Acusticum 2011 (pp. 1541-1546). Denmark: Aalborg.
- Abed, A.H.M. and Cain, G.D., 1978. Low-pass digital filtering with the host windowing design technique. Radio and Electronic Engineer, 48(6), pp.293-300.
- Abed, A.E. and Cain, G., 1984. The host windowing technique for FIR digital filter design. IEEE transactions on acoustics, speech, and signal processing, 32(4), pp.683-694.